")
In this tutorial, we will explore how to handle financial data using R, particularly focusing on the quantmod package. This package is designed for quantitative financial modeling and provides tools for downloading financial data, charting, and applying technical indicators.
|
1 2 |
install.packages("quantmod") library(quantmod) |
For GDPR countries , Yahoo required an agreement. Then working with a VPN is a good solution to make it work. For anyone having another solution please leave a comment.
Since a few years google doesn’t allow the API to get the data. So many guidances on the net using Google finance are currently out of date.
1. Downloading Financial Data
The first step in analyzing financial data is to download it. The getSymbols function from the quantmod package allows you to retrieve stock data from various sources, including Yahoo Finance (the default source) , FRED or Oanda.
|
1 |
getSymbols("AAPL") |
This command retrieves historical stock data for Apple Inc. and stores it in an object named AAPL.

The different columns match with the OHLC format. OHLC stands for Open, High, Low, Close, which are four data points used to describe the price movement of a financial security over a specified period of time, usually one day.
AAPL is directly created in the global environment. No need to assign a variable.

The function has many options, it is also possible to select prices only for a period of time.
|
1 |
getSymbols("AAPL", from = "2014-01-01", to = "2024-10-01",source="YAHOO") |
Here we work with time series and to simplfy data manipulation the formt of AAPL is an xts object. The library xts ( eXtensible Time Series) is loading within the quantmod package. It is build to handle time series data proposing specific function. Remember that handling those data has some differences with dataframes.
Below a few function related to xts library.
|
1 |
to.monthly(AAPL) ##Get only value once a month |
|
1 |
Ad(AAPL) ##get only Adjusted value |
|
1 |
Looking at the Yahoo finance source , we have access to a lot of indices.
|
1 |
yahooQF() |

|
1 |
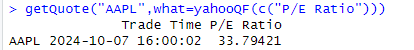
getQuote("AAPL",what=yahooQF(c("P/E Ratio"))) |
Visualization
Now we ave obtained the data, it is quite easy to get a visual analysis of the stock price. Quantmod propose many figures and the possibilitie to add easily indicators.
|
1 |
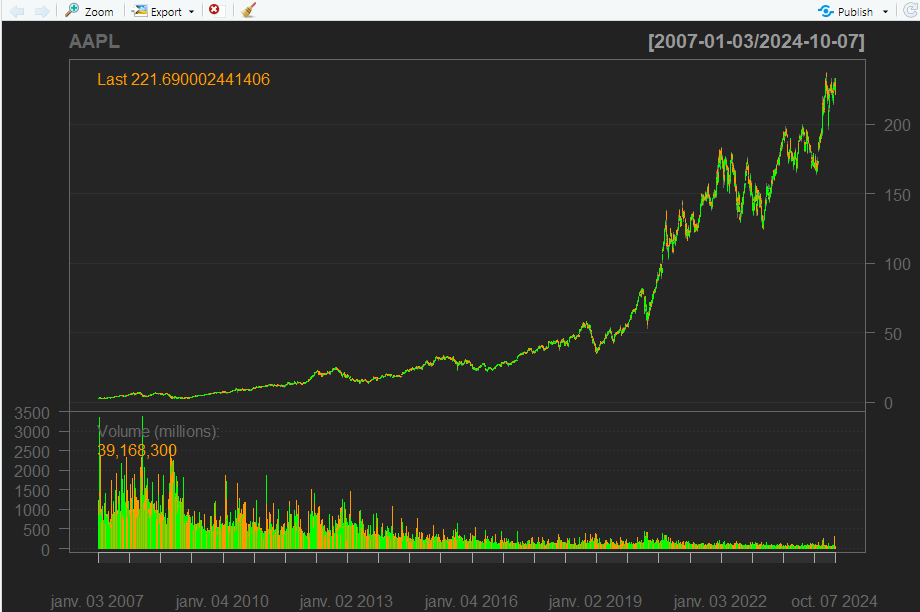
chartSeries(AAPL) |
It is is also easy to zoom on a particular period.
|
1 |
zoomChart('2023') |
Many other options allow us to visualize different financial indicators.
List of some Technical Indicators in quantmod
- Simple Moving Average (SMA) : addSMA()
- Exponential Moving Average (EMA) : addEMA()
- Bollinger Bands: addBBands()
- Moving Average Convergence Divergence (MACD): addMACD()
- Relative Strength Index (RSI): addRSI()
- Average True Range (ATR): addATR()
- Momentum: addMomentum()
- Rate of Change (ROC): addROC()
- Chaikin Money Flow (CMF): addCMF()
- Commodity Channel Index (CCI) : addCCI()
- Directional Movement Index (ADX): addADX()
- Stochastic Momentum Index (SMI): addSMI()
- Parabolic Stop and Reverse (SAR): addSAR()
- Williams %R: addWPR()
- Triple Smoothed Exponential Oscillator (TRIX): addTRIX()
- Volume Indicator: addVo()
|
1 2 3 4 5 6 |
addSMA(n=20) ###Moving Average 20 days addEMA(n=20) ###Exponential Moving Average addBBands() ###Bollinger Bands addMACD() ###Moving Average Convergence Divergence addRSI(n=14) ###Relative Strength Index zoomChart('2024') ###Zoom on year 2024 |
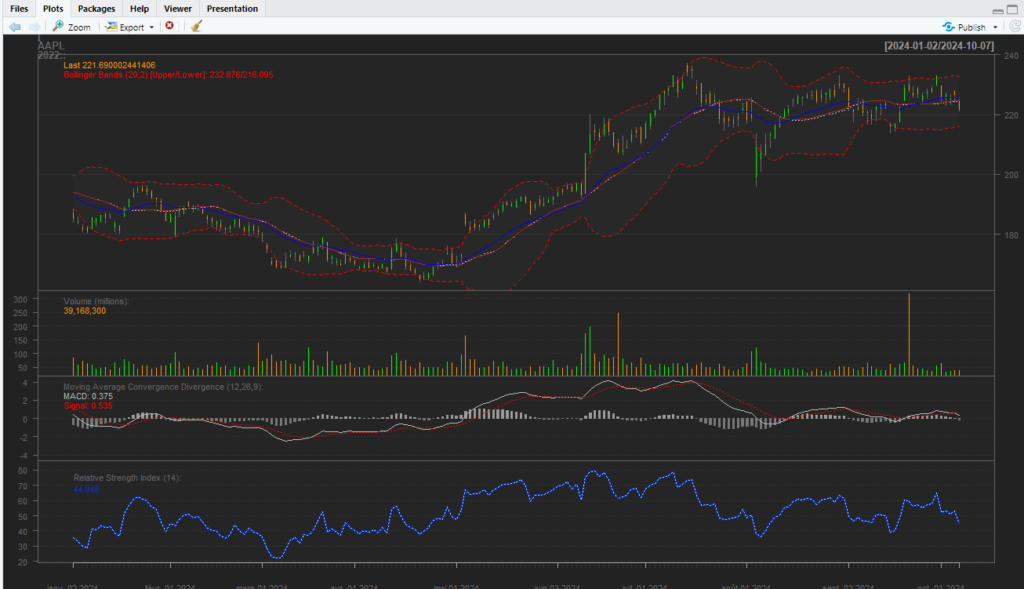
In a few line of code we have obtained a lot of details related the Apple stock price. Quantmod is a great package proposing a lot of financial features.
In this first part, we’ve explored the foundational tools and functions provided by the quantmod package in R, a powerful resource for financial data analysis and visualization. From downloading stock data with getSymbols() to adding technical indicators like SMA, EMA, MACD, and Bollinger Bands to your charts, quantmod makes it simple to analyze market trends and build trading strategies.
As you continue working with quantmod, you’ll discover how easily you can extend its capabilities by combining these indicators, fine-tuning parameters, and integrating more advanced analytics, like backtesting strategies. Don’t hesitate to experiment with different indicators, timeframes, and asset classes to enhance your understanding and improve your analyses.
In a second part we will start to look at how to use it to create a portfolio.
Happy coding and trading!
Hello, i believe that i saw you visited my web site so i got
here to go back the desire?.I’m trying to find things to improve my website!I suppose its adequate to make use of some of your ideas!!