
WorldFootballR is a powerful tool for exploring European football data. From historical records to up-to-date statistics, the package provides a wealth of information for analyzing team, player, and match performance.
These data mainly come from 3 websites,
FBREF: A comprehensive source for detailed match and player statistics across major leagues and competitions worldwide
UNDERSTAT: Specializes in advanced metrics like expected goals (xG) and expected assists (xA), providing deep insights into player and team performances
TRANSFERMARKT: Known for its extensive database of player transfers, market values, and contract information
Full code presented is availble here: https://github.com/FlipR-data/worldFootballR
Installing worldFootballR
First, the package source can be found here : https://github.com/JaseZiv/worldfootballR
Player level data:
In this first tutorial we will focus on data related to players. The function player_dictionary_mapping() provides all the urls (FBREF and Transfer Market) for each players.
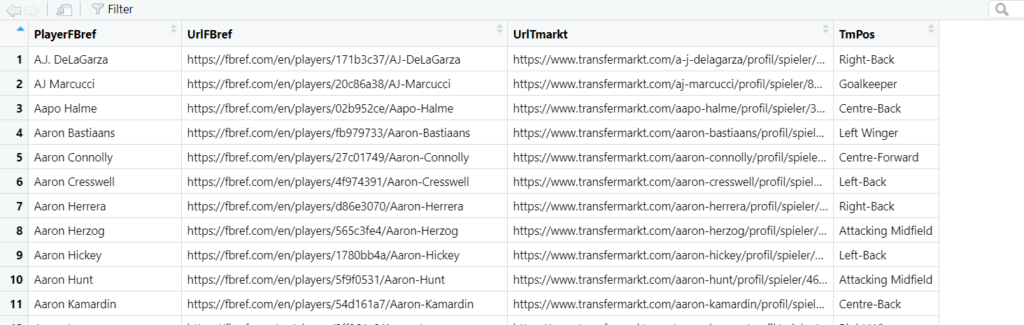
For example the url related to Mohamed Salah send us to his FBREF web page
Let’s see what kind of information we can get. We call the fb_player_scouting_report() function.
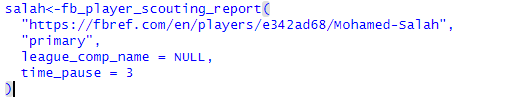
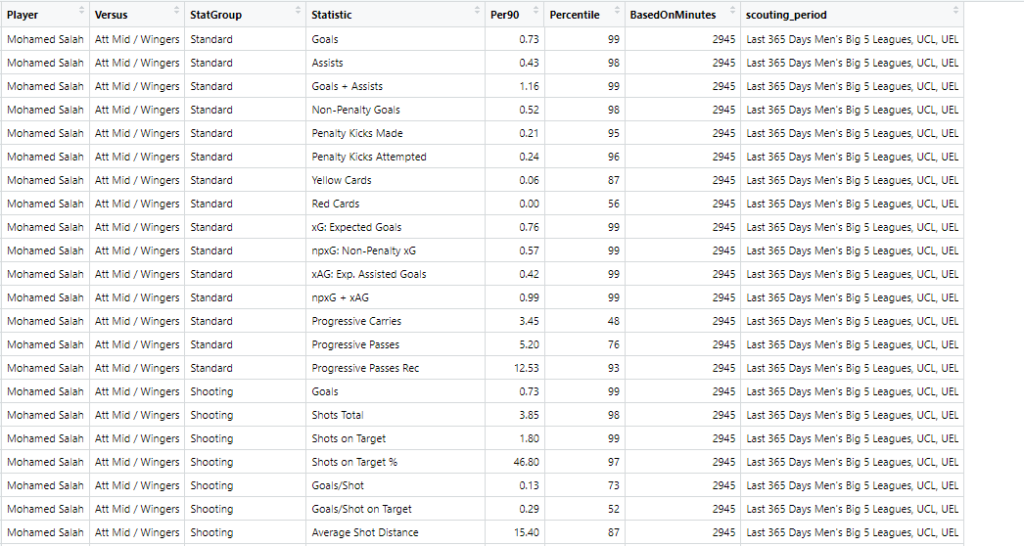
As we can see many statistics are avaialble for all of the player’s competition. Let’s focus on a 11 of them.
Note: We’ve limited our analysis to these parameters, but feel free to explore other options. Each user may have unique preferences for the most relevant players characteristics. In the example below, we’ve attempted to cover attack, defense, and passing
Goals
- Definition: The number of times a player has scored a goal.
- Significance: A fundamental measure of a player’s attacking prowess and goal-scoring ability.
xG (Expected Goals)
- Definition: A statistical metric that estimates the likelihood of a goal being scored from a given shot based on factors like shot location, angle, and goalkeeper positioning.
- Significance: Helps to assess the quality of a player’s chances and whether they are underperforming or outperforming their expected goal output.
Pass Completion
- Definition: The percentage of successful passes a player has completed.
- Significance: Measures a player’s accuracy and efficiency in passing the ball.
Assists
- Definition: The number of times a player has provided a pass that directly led to a goal.
- Significance: Indicates a player’s ability to create scoring opportunities for teammates.
Key Passes
- Definition: Passes that directly led to a shot on goal.
- Significance: Indicates a player’s ability to create dangerous scoring opportunities for teammates.
GCA (Goal-Creating Actions)
- Definition: Actions that directly contribute to a goal, including passes, dribbles, and shots that lead to scoring opportunities.
- Significance: A broader measure of a player’s offensive contributions, encompassing not only assists but also other actions that create chances for goals.
Tackles
- Definition: The number of successful defensive actions taken to prevent an opponent from gaining possession of the ball.
- Significance: Measures a player’s defensive contributions and ability to disrupt opponents’ attacks.
Blocks
- Definition: Actions that prevent a shot from reaching the goal, such as blocking a shot with a body part or using a defensive tackle.
- Significance: Indicates a player’s ability to disrupt opponents’ attacks and prevent goals.
Clearances
- Definition: Actions that remove the ball from danger, such as clearing the ball away from the goal or a teammate.
- Significance: Measures a player’s defensive contributions, particularly in preventing crosses or long balls from reaching dangerous areas.
Touches
- Definition: The number of times a player has touched the ball.
- Significance: A measure of a player’s involvement in the game. A higher number of touches often indicates a player’s greater influence on the match.
Successful Take-Ons
- Definition: The number of times a player has successfully dribbled past an opponent.
- Significance: A measure of a player’s ability to beat defenders and create scoring chances. A high number of successful take-ons indicates a player’s dribbling skill and confidence.
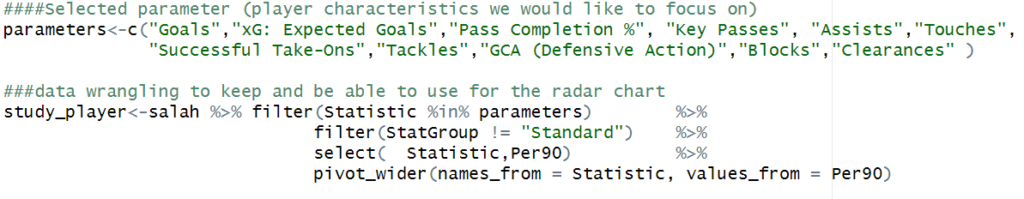
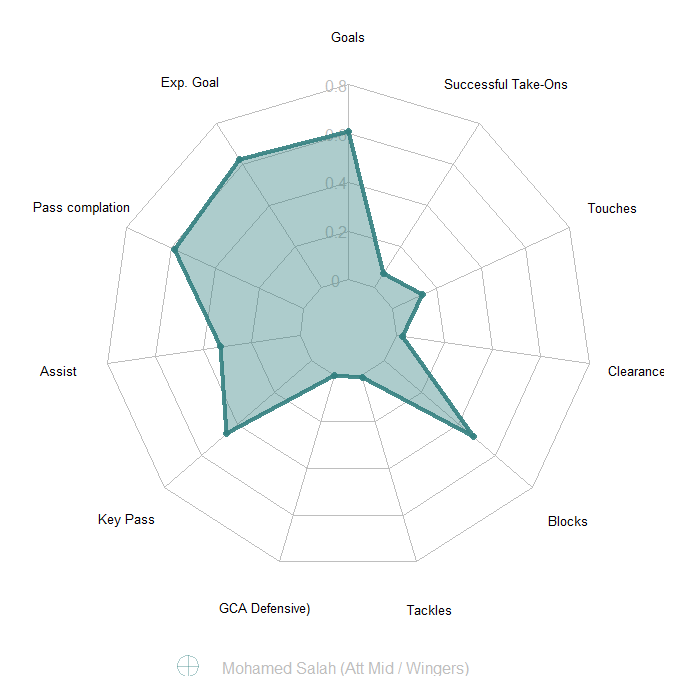
The code above, transpose also the data with the pivot_wider function. We get then a new data frame with 11 columns and 1 row:

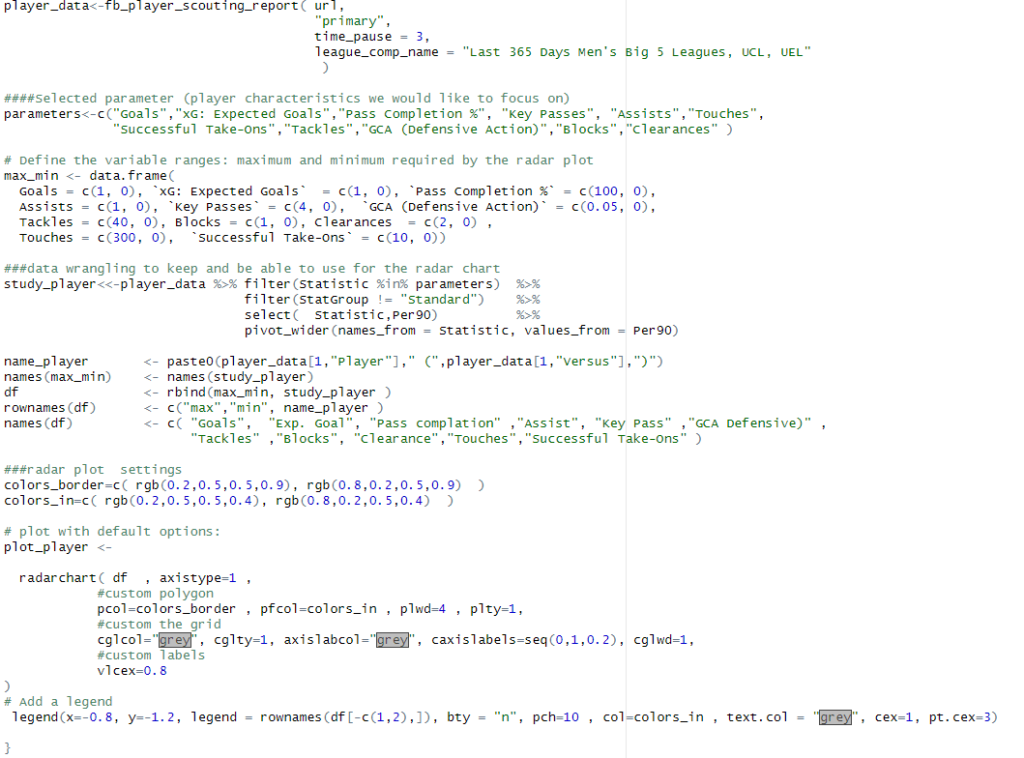
There are many ways to produce a radar plot. Here we have chosen the library fmsb and the function radarchart. This function requires a minimal and a maximum value for each parameter.
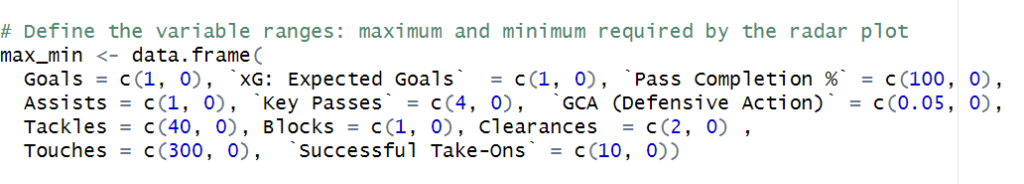
We add those values to the player data.

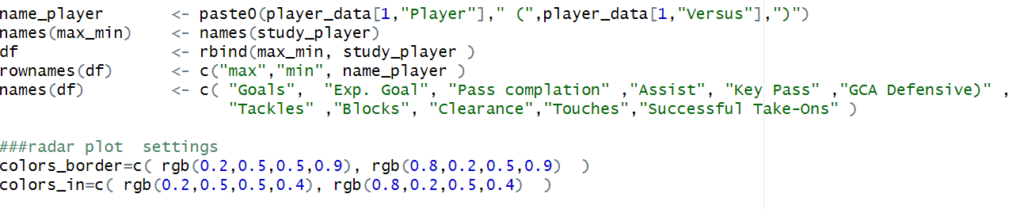
Before to run the function, we also prepare the data especially to get some nice labels and colors.
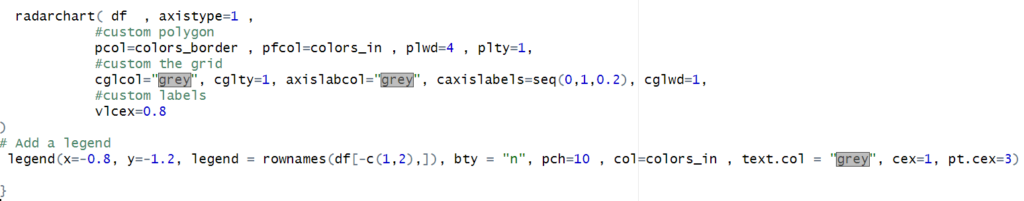
The radar chart visualizes M. Salah’s 11 key characteristics. His attacking prowess, particularly in Goals and Key Passes, is immediately apparent.
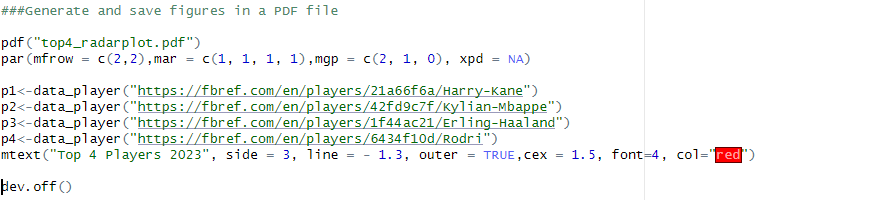
Now we have the differents steps to get the radaplot, we can easily create a function and test it on the 4 best players of the 2023 season. As per de website KHEL NOW’S the top 4 are:
- Erling Haaland (Manchester City/Norway) : https://fbref.com/en/players/1f44ac21/Erling-Haaland
- Kylian Mbappé (Paris Saint-Germain/France) : https://fbref.com/en/players/42fd9c7f/Kylian-Mbappe
- Rodri (Manchester City/Spain) : https://fbref.com/en/players/6434f10d/Rodri
- Harry Kane (Bayern Munich/England) : https://fbref.com/en/players/21a66f6a/Harry-Kane

Below the function: (full code available here)
We apply the function to the top 4 and save the result into a pdf file .

The radar plots for the top 4 players in 2023 reveal a clear dominance of forwards, with only one midfielder represented. All four players exhibit strong attacking characteristics, as evidenced by their consistently high Goal and Expected Goal values. Rodri, the lone midfielder, demonstrates defensive prowess in Blocks and Goal Contributions (GCA). As expected for a midfielder, his Touch capabilities are superior.
In this tutorial, we’ve explored how to utilize FBREF data for basic player analysis. In the upcoming tutorial, we’ll examine the player data offered by Understat and Transfermarkt, accompanied by other visual demonstrations.
Be the first to comment